
Is a high ROE always good? And does a high price-to-book ratio necessarily mean that a stock is expensive?
One of the relationships that stood out to me while studying Chapter 19 — Financial Statement Analysis — of Investments, by Zvi Bodie, Alex Kane and Alan J. Marcus, was how these two metrics can be linked directly through valuation.
The bridge between ROE and P/B
Starting from the Gordon growth model and assuming a company in stable growth, we can derive:
P/B = (ROE − g) / (k − g)
where:
- ROE is return on equity;
- g is the sustainable growth rate;
- k is the cost of equity, or the return required by shareholders.
The intuition is powerful. If a company earns an ROE above the return required by shareholders, each monetary unit reinvested tends to create value. It therefore makes sense for the market to be willing to pay more than one unit for each unit of accounting equity.
If ROE = k, reinvestment is, in principle, neutral for value creation and theoretical P/B converges to 1. If ROE < k, growth may actually destroy value.
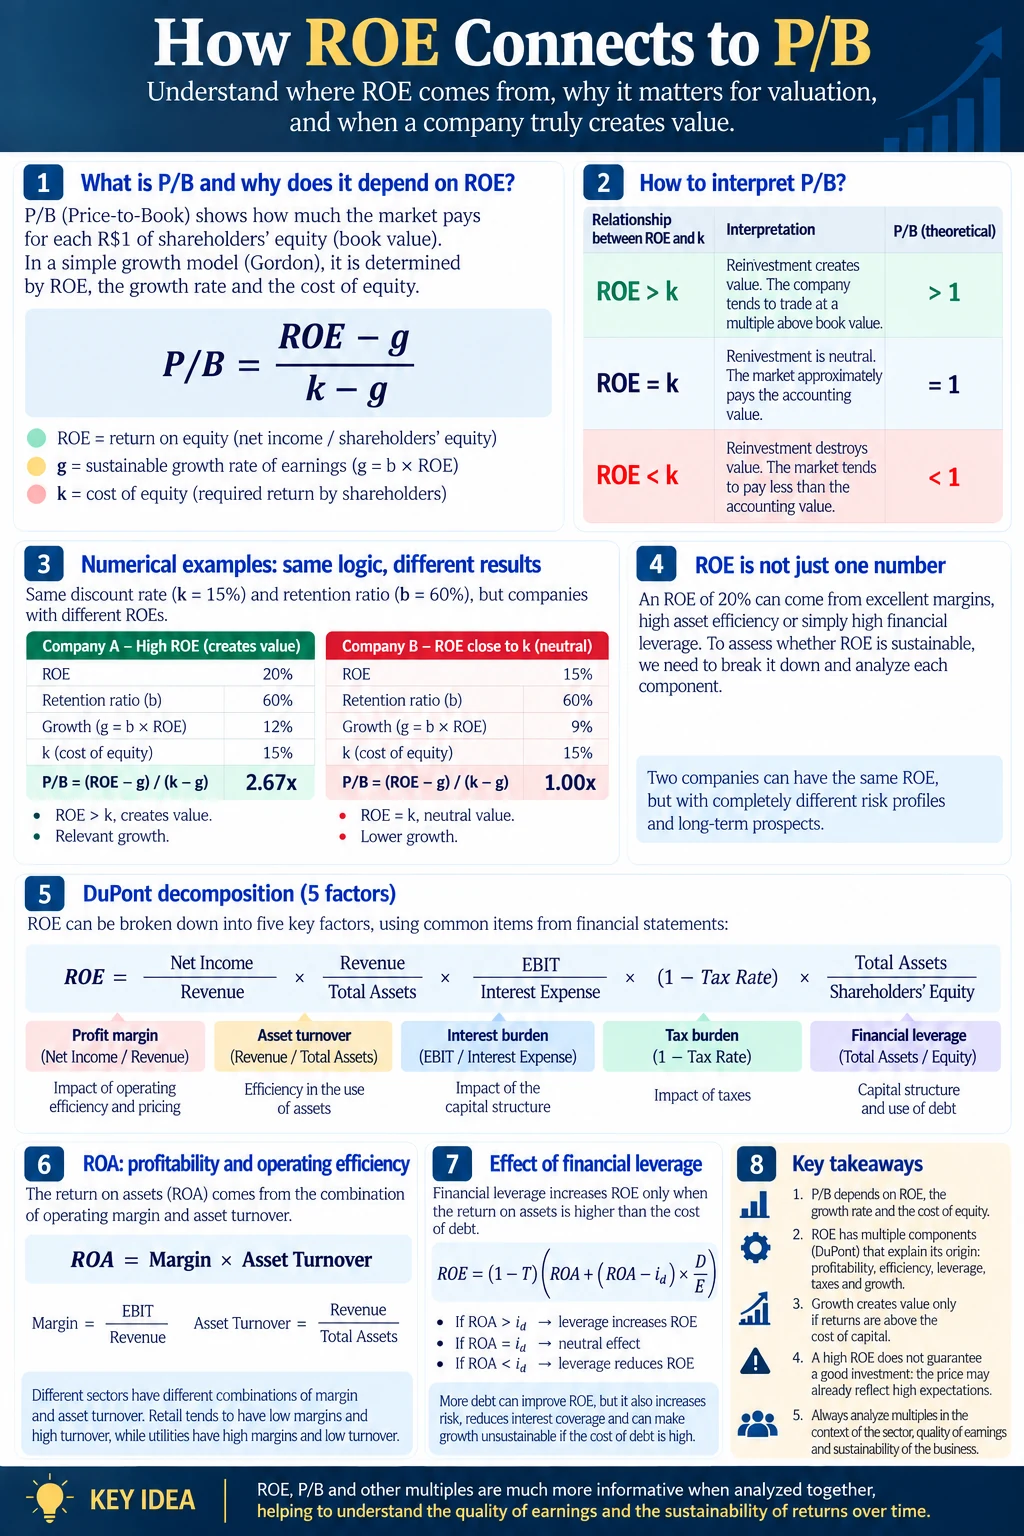
Relationship among ROE, growth, cost of equity and P/B, including the DuPont decomposition. Prepared by OTR Capital. The visual is presented in Portuguese.
A useful relationship — with assumptions
The formula should not be read as an identity that holds for every company at every point in time. Among other conditions, it assumes stable growth, k > g, a sustainable relationship between earnings retention and growth, and consistent accounting measures of earnings and equity.
In practice, ROE, growth, payout and the cost of capital change over time. Intangible assets, share repurchases, accounting write-downs and very small or negative book equity may also reduce the usefulness of P/B. The equation works better as a framework for reasoning than as a shortcut to fair value.
Where does ROE come from?
Looking only at the final figure may conceal fundamentally different companies. This is where the DuPont decomposition helps by separating ROE into its components:
ROE = tax burden × interest burden × operating margin × asset turnover × financial leverage
In accounting terms:
ROE = (Net Income / EBT) × (EBT / EBIT) × (EBIT / Sales) × (Sales / Assets) × (Assets / Equity)
Looking first at operations:
Operating ROA = operating margin × asset turnover
A company may therefore report a high ROE because it has excellent margins, because it uses its assets very efficiently or simply because it operates with substantial financial leverage. These three situations have very different implications.
Debt, for example, may increase shareholder returns when assets earn more than the cost of debt. But if a company begins financing assets that earn less than the interest rate it pays, the same leverage starts reducing returns and increasing financial risk.
The more useful question may therefore not be “what is the company's ROE?” but rather: what is producing that ROE, and is the return sustainable?
A low P/B is not automatically cheap
This logic also shows why analyzing P/B in isolation can be misleading. A company trading at 2.5 times book value may be more economically justified than another trading at 0.7 times — depending on its ability to earn returns above the cost of equity and reinvest sustainably.
The observed multiple also embeds expectations. An excellent business may be a poor investment if its price already assumes extraordinary returns for too long. Likewise, a P/B below 1 may represent an opportunity, but it may also signal weak profitability, overstated accounting assets or expected value destruction.
In summary
- A high ROE creates value only when it adequately exceeds the cost of equity and can be sustained.
- P/B reflects profitability, growth, risk and expectations; it should not be read in isolation.
- DuPont analysis helps separate operating profitability, efficiency, financial effects, taxes and leverage.
- More growth is not automatically better: reinvesting below the cost of capital destroys value.
- The analysis must consider the industry, earnings quality, capital structure and the price paid.
Ultimately, multiples become much more informative when we connect price, profitability, operating efficiency, growth and capital structure.
Sources and references
- Bodie, Zvi; Kane, Alex; Marcus, Alan J. Investments. Chapter 19 — Financial Statement Analysis.
- Aswath Damodaran — Determinants of Price to Book Ratios.
- CFA Institute — Financial Analysis Techniques.
This material is for educational purposes only and does not constitute investment advice. Applying these relationships requires company-specific analysis of financial statements and valuation assumptions.